Characteristic |
Beta |
95% CI 1 |
|---|---|---|
| mu2_(Intercept) | 0.56 | 0.29, 0.85 |
| mu3_(Intercept) | -2.5 | -2.9, -2.1 |
| mu2_smoking | -0.17 | -0.26, -0.09 |
| mu3_smoking | 0.59 | 0.51, 0.67 |
| 1
CI = Credible Interval |
||
Lung Cancer Prediction by Smoking and exposure to air pollution
How does the risk of lung cancer vary across different levels of smoking and air pollution exposure?
Context
Lung cancer is the second most prevalent cancer in the United States in 2024, with smoking being a major risk factor directly linked to its development. Understanding how different levels of smoking and air pollution exposure affect the likelihood of lung cancer is essential for both unraveling the complexities of the disease and enhancing preventive measures. By utilizing data modeling techniques, we can visualize and analyze how variations in smoking habits and air pollution contribute to lung cancer risk. This approach helps reveal underlying patterns and relationships, ultimately supporting the development of more effective prevention strategies and informing public health initiatives aimed at reducing lung cancer incidence.
Smoking vs. Cancer Risk
To determine the extent to which smoking increases the risk of lung cancer, a categorical model can be developed. This model will help quantify the relationship between smoking and the likelihood of developing lung cancer, providing a clearer understanding of how smoking contributes to the cancer’s risk.
- Formula
\(\text{risk} = \beta_0 + \beta_1 (\text{smoking})_i + \epsilon_i\)
- Table
- Plot of Posterior Prediction (Air Pollution)
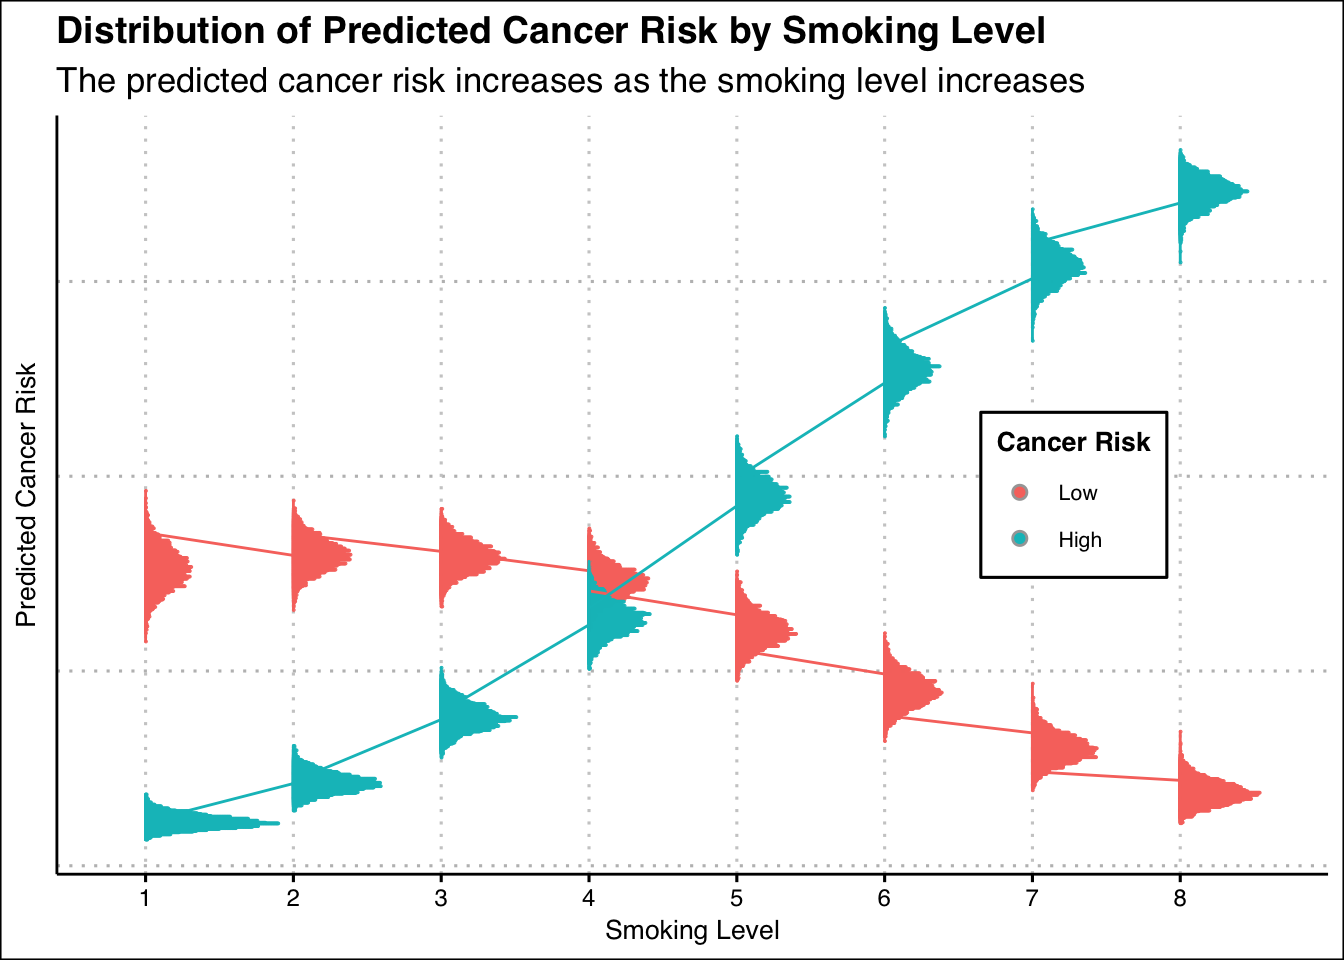
The graph clearly shows that the risk of lung cancer rises with higher levels of smoking, a fact well-documented in medical research. However, a more intriguing pattern emerges when we examine how the risk of lung cancer is influenced by different levels of air pollution. This additional layer of analysis reveals complex interactions between smoking and air pollution, offering new insights into how these factors together impact lung cancer risk.
Air Pollution vs. Cancer Risk
To examine the relationship between lung cancer and air pollution, we can construct a categorical model. This model will help us assess how different levels of air pollution influence the risk of developing lung cancer, both independently and in conjunction with other factors like smoking.
- Formula
\(\text{risk} = \beta_0 + \beta_1 (\text{air\_pollution})_i + \epsilon_i\)
- Table
Characteristic |
Beta |
95% CI 1 |
|---|---|---|
| mu2_(Intercept) | -0.29 | -0.60, 0.05 |
| mu3_(Intercept) | -4.6 | -5.3, -4.0 |
| mu2_air_pollution | 0.14 | 0.03, 0.24 |
| mu3_air_pollution | 1.1 | 1.0, 1.3 |
| 1
CI = Credible Interval |
||
- Plot of Posterior Prediction (Smoking)
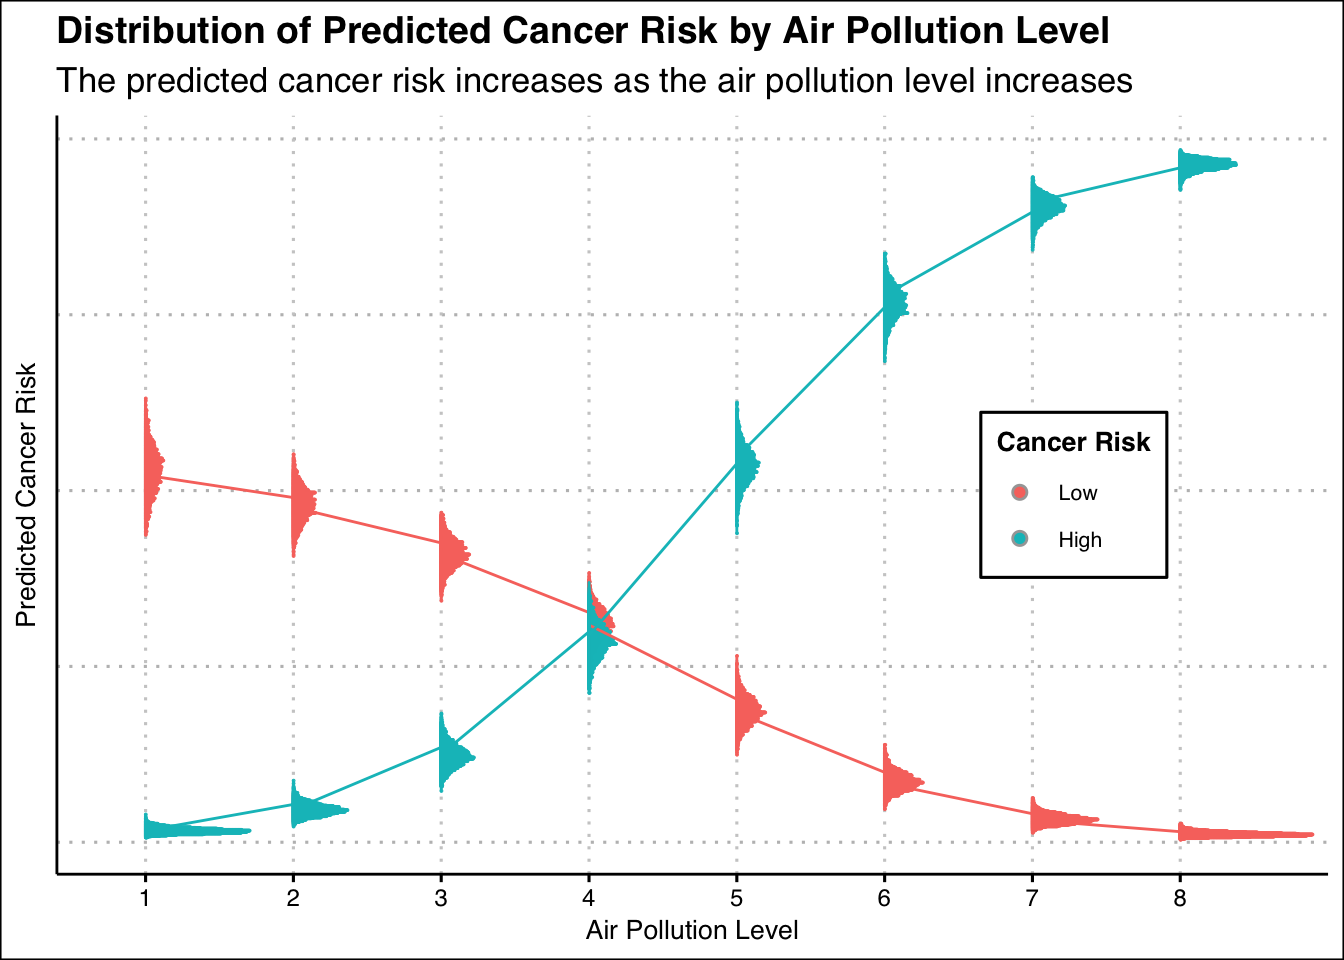
The graph clearly indicates that the risk of lung cancer increases with higher levels of air pollution, which may initially seem surprising. Both smoking and air pollution exhibit similar trends in predicting lung cancer risk. To gain a comprehensive understanding, it is crucial to compare their relative impacts and determine how each contributes to the overall risk of developing the disease.
Air Pollution + Smoking vs. Cancer Risk
To determine which factor—smoking or air pollution—has a greater impact on the risk of lung cancer, a Gaussian model can be constructed. This model will help analyze and compare the influence of each factor, providing a clearer understanding of their relative contributions to the disease.
- Formula
\(\text{risk} = \beta_0 + \beta_1 (\text{air\_pollution}) + \beta_2 (\text{smoking}) + \beta_3 (\text{age})_i + + \beta_4 (\text{male}) + \epsilon_i\)
- Table
Characteristic |
Beta |
95% CI 1 |
|---|---|---|
| smoking | 0.09 | 0.07, 0.11 |
| air_pollution | 0.20 | 0.18, 0.22 |
| gender | ||
| genderMale | -0.03 | -0.11, 0.05 |
| age | 0.00 | 0.00, 0.00 |
| 1
CI = Credible Interval |
||
- Heatmap of Posterior Prediction (Smoking + Pollution)
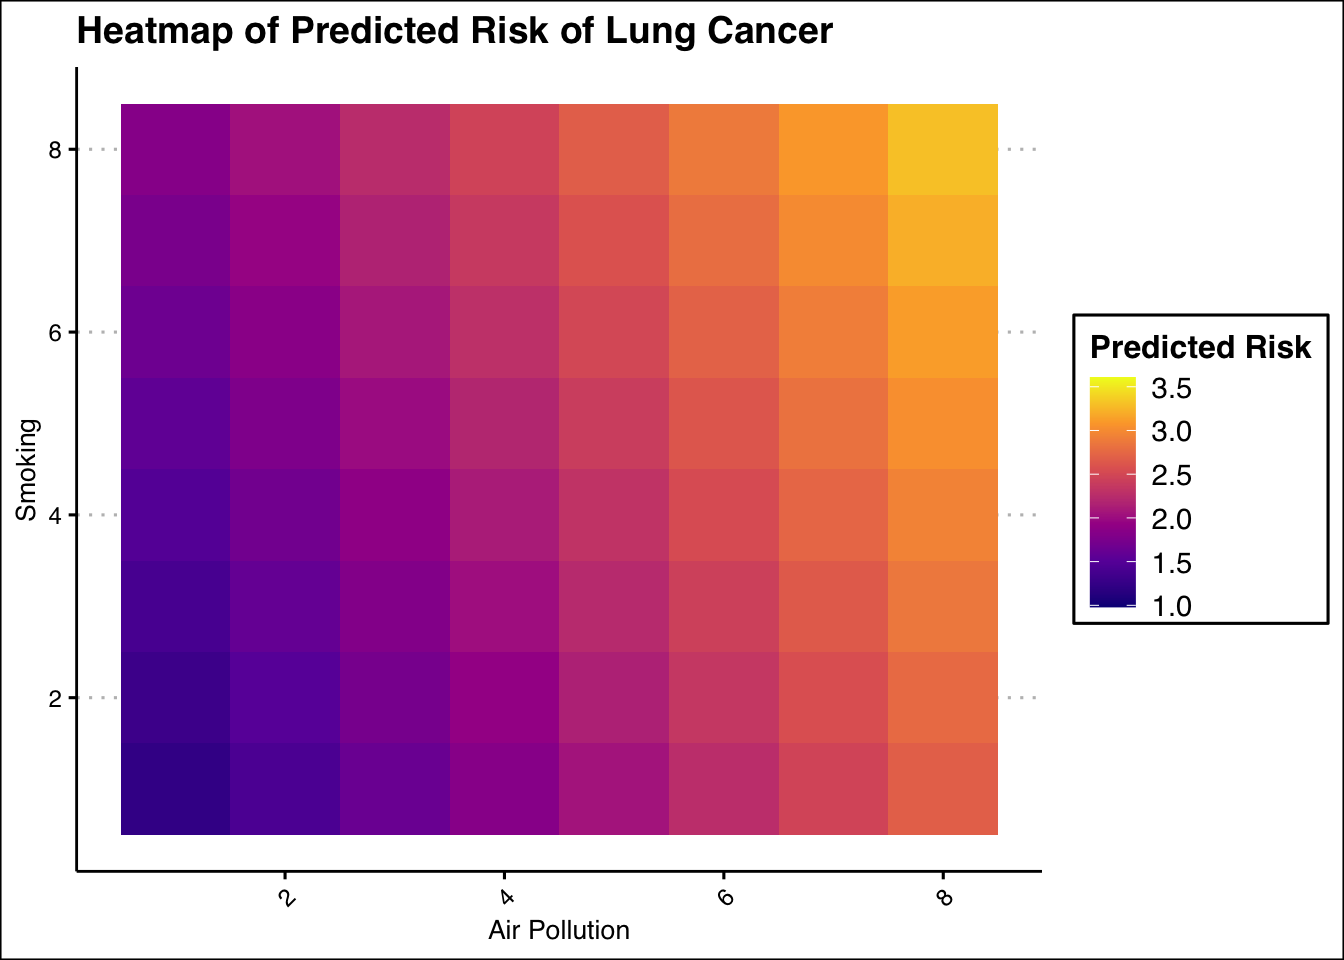
Air pollution has a greater impact on lung cancer risk compared to smoking. The impact of air pollution is significantly higher, indicating that reducing air pollution is more crucial for lowering lung cancer risk than reducing smoking. Addressing air pollution should be a priority in lung cancer prevention strategies.
Analysis
To determine which factor, smoking or air pollution, has a greater impact on lung cancer risk and quantify this difference, we need to compare their regression coefficients and their credible intervals.
- Regression Coefficients and Credible Intervals:
- Smoking: \(\beta_2 = 0.09\) (95% CI: 0.07, 0.11)
- Air Pollution: \(\beta_1 = 0.20\) (95% CI: 0.18, 0.22)
Comparison: From the coefficients, it is clear that air pollution has a larger impact on lung cancer risk compared to smoking.
Difference in Impact: The difference in the impact of air pollution and smoking on lung cancer risk is given by: \(\beta_1 - \beta_2 = 0.20 - 0.09 = 0.11\)
Credible Interval for the Difference: To compute the credible interval for this difference, we can approximate it using the provided credible intervals for the individual coefficients. The variance of the difference of two independent variables is the sum of their variances. However, since we only have the credible intervals, we will assume independence and add the ranges conservatively.
- Lower Bound Difference: \(0.18 - 0.11 = 0.07\)
- Upper Bound Difference: \(0.22 - 0.07 = 0.15\)
Thus, the credible interval for the difference between the impact of air pollution and smoking is approximately (0.07, 0.15).
Conclusion
Air pollution has a greater impact on lung cancer risk than smoking, with an estimated difference in their effects of 0.11. The 95% credible interval for this difference is approximately (0.07, 0.15). This means air pollution is worse than smoking in terms of increasing lung cancer risk, with a difference ranging between 0.07 and 0.15 in their respective impacts.